
In 2023, 65% of financial institutions used Python for risk management. By 2026, that number is the baseline, not the benchmark. JPMorgan Chase now trains all incoming analysts on Python. Goldman Sachs runs its risk infrastructure on it. Citigroup uses it for derivatives pricing and portfolio analysis. Python is no longer a nice-to-have skill for data professionals; it is table stakes.
This post will not promise you fluency in 30 days. It will not list 47 resources and leave you more confused than when you started. Instead, it provides a structured, honest roadmap: what to learn, in what order, with which tools, and over what timeline. If you are considering a move into data analytics, or you already work with data and want to add Python to your toolkit, this guide is written for you.
If you are still deciding which data role fits your background, start with our comparison of data analyst, data scientist, and analytics engineer roles. For a broader view of the tools you will encounter across different roles, see our guide to foundational tools for data careers.
Why Python for Analytics in 2026
Python holds the #1 position in the TIOBE Index as of March 2026, a ranking it has maintained for over four years. According to the 2025 Stack Overflow Developer Survey, Python remains one of the most used and most wanted programming languages globally. Across data-specific job postings, 57% list Python as a requirement, making it the single most demanded technical skill in the analytics job market.
But popularity alone is not a reason to learn something. The real argument for Python in analytics comes down to three factors.
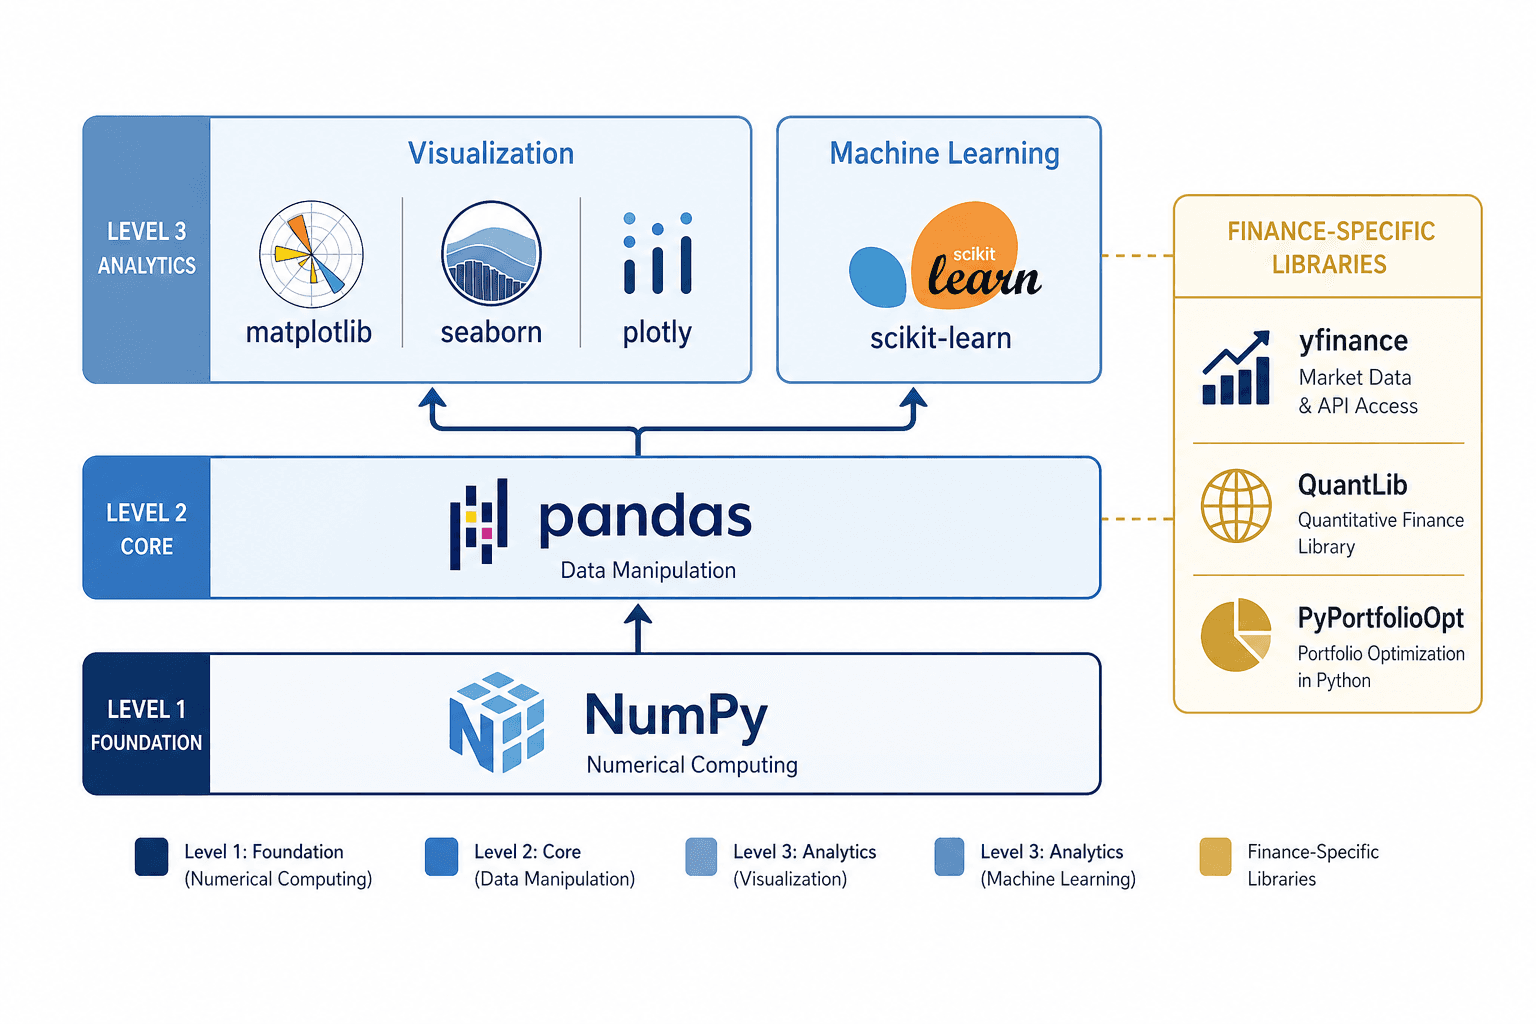
The ecosystem is unmatched. No other language offers the same combination of data manipulation (pandas), numerical computing (NumPy), machine learning (scikit-learn), and visualization (matplotlib, seaborn, plotly) in a single, cohesive environment. R comes close for statistical analysis, but Python's versatility across analytics, automation, and production deployment makes it the default choice for most teams. For a deeper look at how Python compares with R and SQL, Coursera's analysis provides a balanced comparison.
Finance runs on Python. This is not hyperbole. The Corporate Finance Institute documents Python's use in risk modeling, portfolio optimization, derivatives pricing, and regulatory reporting across major financial institutions. Libraries like yfinance for market data, QuantLib for derivatives, and PyPortfolioOpt for portfolio construction give Python a finance-specific toolkit no other language matches. If you are entering analytics in financial services, banking, insurance, or fintech, Python is your primary working language.
The salary premium is measurable. According to PayScale data for 2026, a data analyst with Python skills earns approximately $74,062 on average, compared to roughly $41,000 for analysts without programming skills. That is a premium of approximately $33,000 per year. Junior data analysts with Python start at around $64,597, while senior analysts with Python command averages above $97,670.
The Honest Timeline: What to Expect
Most guides promise fluency in 30 days or 8 weeks. This is marketing, not education. Research from Noble Desktop and BrainStation consistently shows that reaching job-readiness in Python for analytics takes 6 to 12 months of consistent study at 10 to 15 hours per week. That is the honest number.
Here is what that timeline looks like in practice:
| Period | Focus | What to Expect |
| Weeks 1-2 | Python syntax basics | High motivation, rapid visible progress. Variables, loops, and functions feel manageable. |
| Weeks 3-6 | Data structures, functions | The frustration plateau. Progress feels slower. This is normal and universal: it is not a sign of failure. |
| Weeks 6-12 | NumPy, pandas basics | The transition from "learning Python" to "using Python for analytics." DataFrames, CSV loading, data cleaning. |
| Weeks 12-16 | Visualization, EDA | Breakthrough phase. You start seeing stories in data. Matplotlib, seaborn, exploratory analysis. |
| Weeks 16-24 | Real projects, basic ML | First portfolio project. Real, messy data. Light scikit-learn. Focus on end-to-end analysis. |
| Months 6-12 | Depth and specialization | Advanced pandas, SQL integration, finance-specific applications, 2-3 portfolio projects. |
Three factors accelerate or extend this timeline: prior programming experience (cuts 2 to 3 months), weekly commitment (consistency matters more than intensity: 2 hours daily beats 14 hours on weekends), and learning format (project-based learning outperforms passive watching). The DataCamp 12-month roadmap provides a useful month-by-month benchmark if you prefer more granular milestones.
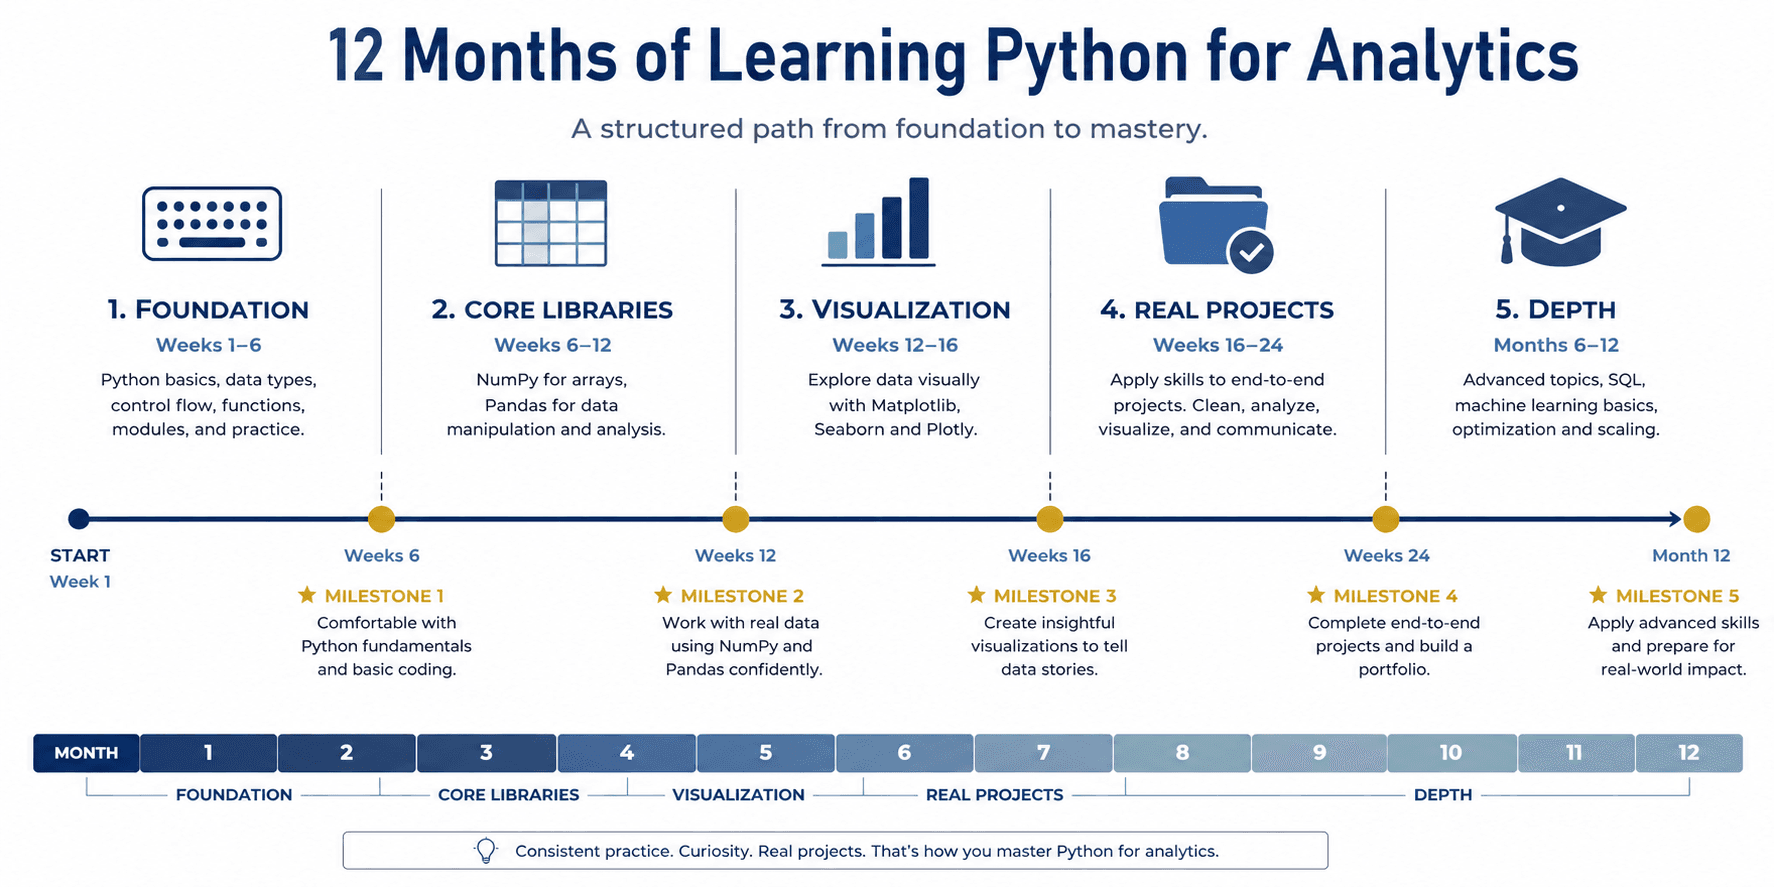
The Real Learning Path: Five Phases
Most roadmaps present a linear sequence of skills: learn syntax, then libraries, then projects. Reality is messier. You will revisit concepts, make mistakes, and build understanding through iteration. Still, structure helps. Here is a phased path that maps directly to the timeline above.
Phase 1: Foundation (Weeks 1 to 6)
Start with Python's core: variables, data types, operators, conditionals, loops, lists, tuples, dictionaries, and functions. Do not worry about classes or object-oriented programming yet. Your goal is to write simple scripts that take input, process it, and produce output.
Finance example: Build a function that calculates compound interest. Input: principal, rate, years. Output: final balance. It is a ten-line function, but it teaches variables, arithmetic operators, function definitions, and return values in a single exercise.
Tool recommendation: Start with Google Colab. It requires zero setup (no Python installation, no environment configuration), runs in your browser, and lets you focus entirely on learning Python rather than debugging your development environment. The Marqo beginner's guide walks through your first notebook in under ten minutes.
Phase 2: Core Libraries (Weeks 6 to 12)
This is where "learning Python" becomes "learning Python for analytics." Two libraries dominate this phase:
• NumPy: arrays, vectorised operations, the mathematical foundation under everything else. Understand why NumPy arrays are faster than Python lists and when that matters.
• pandas: the non-negotiable library for data analytics. DataFrames, read_csv, missing value handling, groupby, pivot_table, merging datasets. You will use pandas in every analytics role, every project, every day.
Finance example: Load a CSV of historical stock prices from yfinance. Calculate daily returns, compute 30-day rolling averages, and identify the most volatile trading days. This is real analytics work using the same tools portfolio managers use.
For a broader view of how these libraries fit into the analytics toolchain, our overview of foundational tools for data careers maps each tool to specific job functions.
Phase 3: Visualization and Exploration (Weeks 12 to 16)
Data visualization is where analytical thinking becomes visible. This phase introduces three libraries in sequence:
• Matplotlib: the foundation. Histograms, scatter plots, line charts. Not the prettiest, but you need to understand it because almost every tutorial and example uses it.
• Seaborn: better defaults, statistical focus. Heatmaps, pair plots, distribution plots. Built on matplotlib but produces publication-quality statistical visualizations with less code.
• Plotly: interactive charts, dashboards. Learn this after you know matplotlib and seaborn. Interactivity is valuable, but understanding what your data shows matters more than how it looks.
Finance example: Visualize a portfolio's performance over time: line chart of cumulative returns, heatmap of asset correlation, and histogram of daily return distribution. These are the exact visualizations a portfolio analyst would produce for a quarterly review.
The Around Data Science comparison offers a practical framework for choosing between these libraries based on your use case.
Phase 4: Real Projects (Weeks 16 to 24)
This is where most learning paths fail. Tutorials teach syntax; projects teach problem-solving. Your first portfolio project should be small in scope but use real data:
• Load data from at least two sources (CSV and API)
• Spend 40 to 50 percent of your time on data cleaning (this ratio reflects real-world analytics)
• Perform exploratory data analysis before any modeling
• If you use scikit-learn, keep it simple: logistic regression, random forest, not neural networks
• Write 2 to 3 business insights, not just technical outputs
Finance example: Build a basic credit risk classifier. Load a public lending dataset (Kaggle has several), clean the data, explore patterns in default rates, build a simple logistic regression model, and explain which features drive risk. This is a project that demonstrates both technical and domain knowledge. For context on why explainability matters in credit risk specifically, see our post on why explainable AI matters more than you think.
Phase 5: Depth and Specialization (Months 6 to 12)
After six months, you have a working foundation. Phase 5 is about depth:
• SQL: essential for accessing production data. Learn it in parallel with Python if you have not already. Our free SQL learning guide provides a structured starting point.
• Advanced pandas: window functions, multi-indexing, performance optimization. These techniques separate junior analysts from mid-level practitioners.
• Finance-specific applications: portfolio optimization with PyPortfolioOpt, VaR calculation with NumPy and SciPy, derivatives basics with QuantLib. These require domain knowledge alongside technical skill.
• Two to three portfolio projects of increasing complexity, documented in GitHub with clear explanations of your analytical process.
Key Tools: What Actually Matters
Tool selection is where beginners lose time. The ecosystem is large, and every blog has a different recommendation. Here is what matters at each stage:
Development Environments
| Tool | Best For | Start Using | Note |
| Google Colab | Absolute beginners, zero setup needed | Day 1 | Free GPU, cloud-based, easy sharing |
| Jupyter Notebook | Interactive analysis, documentation | Month 2 | Transition to local after Colab basics |
| VS Code | Larger projects, production code | Month 6+ | Steeper learning curve, but industry standard |
The Deepnote comparison of Jupyter and VS Code is useful if you want a detailed feature breakdown. The short version: do not overthink this. Start with Colab, switch when the tool limits you, not before.
Pandas vs Polars: The Question That Does Not Matter Yet
Polars is a high-performance DataFrame library that offers 5 to 30x speed improvements over pandas on large datasets. It is genuinely impressive technology. But here is the practical reality for beginners:
• Most beginner datasets are under 1 GB. At that scale, pandas and Polars perform identically for practical purposes.
• Nearly every tutorial, Stack Overflow answer, and code example uses pandas. Learning Polars first creates a translation problem with every learning resource you encounter.
• Once you know pandas, learning Polars takes approximately one week. The reverse is not true.
Recommendation: Learn pandas first. Always. Consider Polars after 3 to 6 months of pandas experience, and only when you are working with datasets large enough (10 GB or more) that pandas actually feels slow. The Real Python comparison provides a balanced technical analysis when you are ready for that conversation.
DuckDB and Modern Analytics Tools
DuckDB is an in-process SQL engine that works directly on Parquet and CSV files. It has seen 50% year-over-year growth in adoption. For finance, its AES-256 encryption support makes it viable for regulated data environments. But for beginners, DuckDB belongs in the "good to know about, not to learn now" category. Focus on pandas and SQL first; DuckDB builds on both.
AI Coding Assistants: A Note of Caution
Tools like GitHub Copilot and Claude Code can accelerate your workflow once you have a foundation. Copilot excels at code completion; Claude Code is stronger at explaining unfamiliar logic. But both carry a risk for learners: they can mask gaps in your understanding. If you cannot write a pandas groupby from memory, an AI assistant that writes it for you is hiding a skill gap, not fixing it. Learn the fundamentals first. Use assistants to accelerate, not to avoid learning.
The Libraries You Will Actually Use
A common mistake is attempting to learn too many libraries at once. The KDnuggets 2026 starter kit makes this point well: 80% of analytics work uses 20% of available libraries. Here is what you need, organised by priority.
Core Stack (Universal)
• pandas: data manipulation. Non-negotiable. Every analytics role uses it.
• NumPy: numerical computing. Arrays, linear algebra, statistical functions. The mathematical foundation under pandas and scikit-learn.
• matplotlib and seaborn: visualization. Matplotlib for fundamentals, seaborn for statistical plots with better defaults.
• scikit-learn: machine learning. Regression, classification, clustering, model evaluation. Start simple (logistic regression, random forest) and stay there for months.
Finance-Specific Stack
If you are pursuing analytics in financial services, these libraries become relevant after 6 months of core Python experience. The Awesome Quant repository on GitHub maintains a comprehensive, actively curated list of quantitative finance libraries.
• yfinance: downloading stock price data from the Yahoo Finance API. Your gateway to real market data.
• QuantLib: derivatives pricing, interest rate models, risk metrics. Advanced, but essential for quantitative roles. The Risk Quant Python guide is the best entry point.
• PyPortfolioOpt: portfolio optimization. Mean-variance optimization, risk parity, and other allocation strategies in a clean API.
• NumPy and SciPy: for Value-at-Risk (VaR), Expected Shortfall, and Monte Carlo simulations. The math matters more than the framework.
What Not to Learn Yet
• TensorFlow and PyTorch: deep learning frameworks. Advanced, resource-intensive, and irrelevant for 95% of analytics work.
• Apache Spark: distributed computing. Relevant at massive scale, not during your learning phase.
• QuantLib (in your first 6 months): the API is complex. Build a solid pandas and NumPy foundation first.
Portfolio managers use pandas, yfinance, and PyPortfolioOpt, not TensorFlow. Credit risk analysts use pandas for data preparation and scikit-learn for models, not deep learning. Match your library choices to the roles you are targeting. Our modern data career map helps clarify which tools map to which positions.
Common Mistakes and How to Avoid Them
The most common reasons beginners quit are preventable. Here are the seven mistakes that cost the most time:
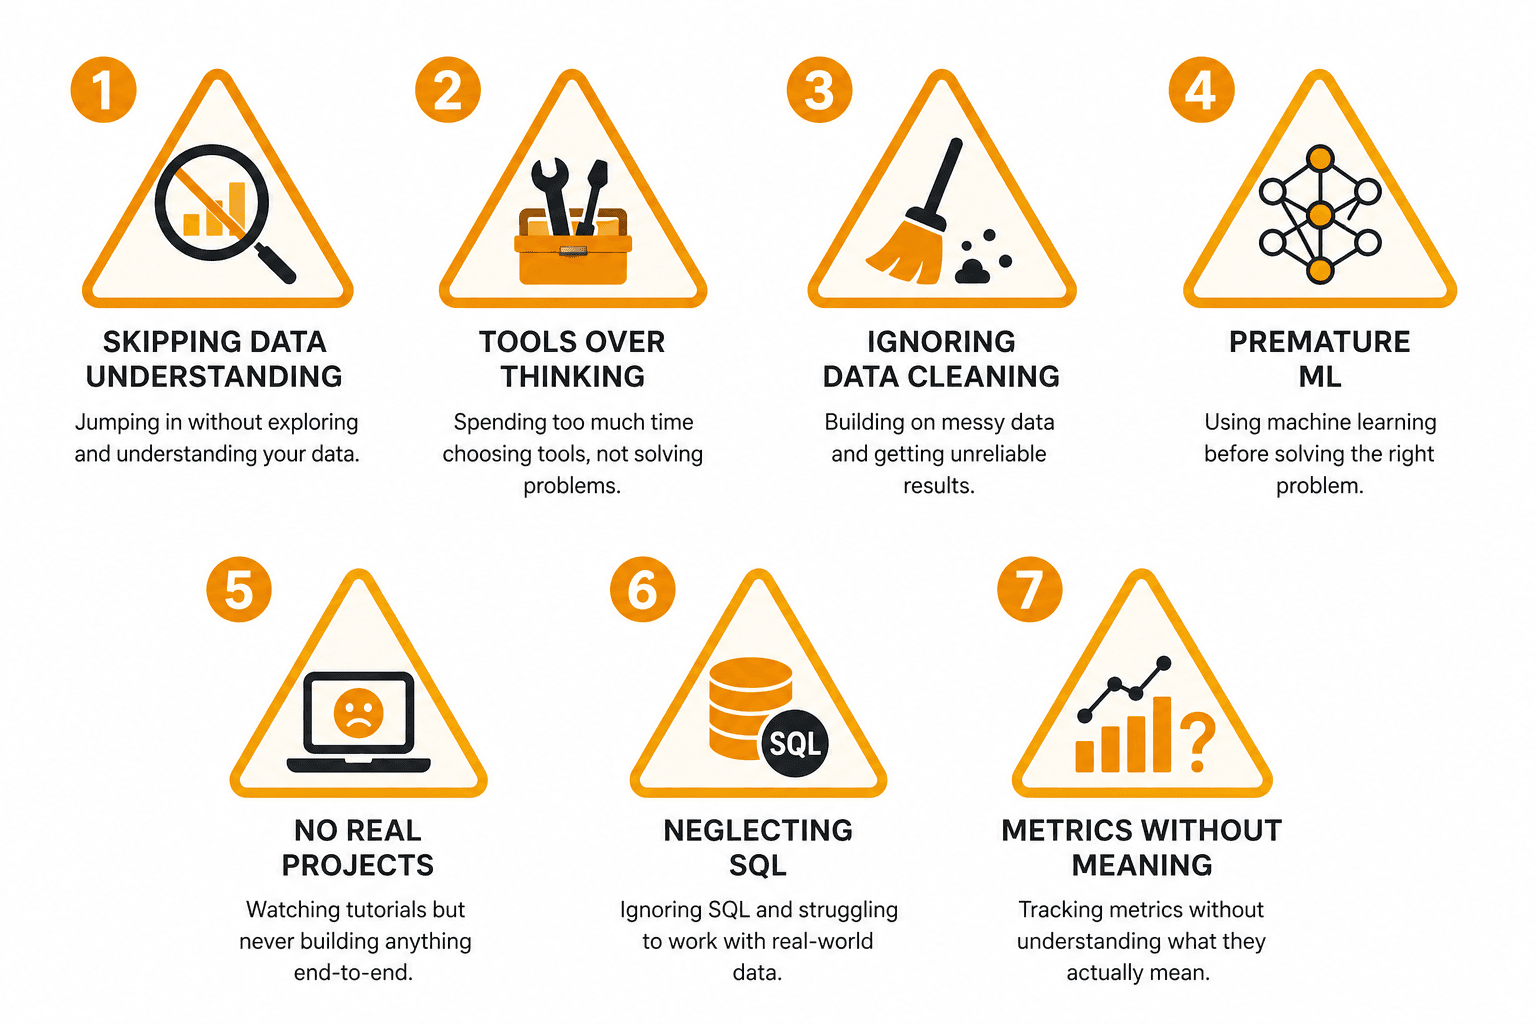
1. Starting analysis without understanding the data.
Before writing any code, ask five questions: Where does this data come from? What does each column represent? What is the time window? Are there known quality issues? What business question are we answering? Skipping this step produces technically correct but business-irrelevant analysis. Our post on data-driven decisions explores this discipline in depth.
2. Overemphasizing tools over analytical thinking.
Learning pandas syntax is necessary but insufficient. For every function you learn, ask: when would I use this? What problem does it solve? A groupby is not just syntax; it is a way of asking "how does this metric differ across categories?" The thinking matters more than the code.
3. Skipping data cleaning.
Real-world data has missing values, duplicates, incorrect types, and outliers. Allocate 40 to 50 percent of every project's time to cleaning and validation. This ratio is not a beginner handicap; it reflects professional practice. The data lifecycle explains why data quality is structural, not incidental.
4. Jumping to machine learning too early.
Spend at least 3 to 4 months on exploratory data analysis, data cleaning, and basic statistical summaries before touching scikit-learn. Most business insights come from well-executed EDA, not from complex models. A clear bar chart showing revenue trends is often more valuable than a neural network nobody can explain. For more on this tension, see our analysis of interpretable vs black-box models.
5. Not building real projects.
Following tutorials teaches you to replicate solutions. Building projects teaches you to solve new problems. Start one real project every month from month 2 onwards. Use messy data, ambiguous questions, and force yourself to make decisions without a tutorial guiding you.
6. Neglecting SQL.
Python handles analysis; SQL handles data access. In most organisations, the data you need lives in databases, not in CSV files. Start SQL basics in parallel with Python around months 2 to 3. Our free SQL learning guide provides a structured path.
7. Focusing on metrics instead of meaning.
An accuracy score of 92% means nothing if you cannot explain what decision the model enables. For every analysis, ask: what action does this insight drive? What is the business impact? In finance, a technically correct model that violates risk limits is worse than no model at all.
Portfolio Projects That Actually Land Interviews
Hiring managers spend approximately 90 seconds reviewing a portfolio, according to Careery's analysis of data analyst hiring patterns. What impresses them is not the number of projects (3 to 5 beats 10 or more) or the complexity of your models. It is evidence that you can handle messy data, think clearly about business problems, and communicate your findings.
Project 1: Exploration (Beginner, Month 3)
Pick a public dataset in finance or retail. Load it, clean it, and explore it. No modeling. Create 5 to 7 visualizations that tell a story. Write 2 to 3 business insights. Document everything in a Jupyter notebook with markdown explanations.
Example: Credit card fraud detection data. What do fraudulent transactions look like? Are there time-of-day patterns? Amount thresholds?
Project 2: Analysis and Prediction (Intermediate, Month 5)
Load data from multiple sources (API and CSV). Clean thoroughly. Perform EDA. Build a basic classification or regression model with scikit-learn. Evaluate performance. Explain results in business language.
Example: Customer churn prediction using behavioral data. What features predict churn? What retention actions would you recommend based on the model?
Project 3: Finance-Specific Depth (Advanced, Month 8)
Demonstrate domain knowledge alongside technical skill. Use finance-specific libraries. Professional documentation. Clear business framing.
Example: Compare passive index tracking vs. strategic portfolio allocation over a 5-year historical window. Show risk-adjusted returns, drawdown analysis, and rebalancing impact.
What Impresses Hiring Managers
• Messy data handled well. They care more about your cleaning process than your model architecture.
• Clear explanation of your thinking. Notebooks with markdown that explains why, not just what.
• Business impact framed in human language. "This analysis suggests $200K in recoverable revenue" is stronger than "RMSE of 0.12."
• Reproducible code. Others can run it, understand it, and build on it.
What Is Different About Python for Analytics
This distinction confuses many learners and is worth making explicit. General Python programming and Python for analytics are different disciplines with different priorities.
General programming emphasizes building applications, software design patterns, testing, deployment, and scalable architecture. Python for analytics emphasizes asking questions, speed of exploration, working with ambiguous and messy data, and communicating insights. In software engineering, you write tests before code. In analytics, you explore first and formalize later. The data ecosystem overview provides context for how analytical work fits into broader organizational data flows.
A useful analogy: learning Python generally is like learning English grammar. Learning Python for analytics is like learning to tell stories in English. Grammar is necessary, but the story is the point.
If you are coming from software engineering, unlearn some habits. Over-engineering is the enemy in analytics; a quick exploratory notebook is more valuable than a perfectly architected class hierarchy. If you are coming from Excel, embrace the shift to programmatic thinking: loops, functions, and automation replace manual cell-by-cell work. Either way, the analytical mindset, asking the right questions and thinking critically about data quality, matters more than the code itself.
Where to Start Right Now
Open Google Colab. Create a new notebook. Write a function that calculates compound interest. That is your first step.
The next 6 to 12 months matter, not because you will become an expert (you will not), but because you will go from data-curious to data-literate. You will load your own data, find your own insights, and build your own portfolio. If you commit 10 to 15 hours per week and follow the phased approach in this guide, you will have a skill set worth a $33,000 annual salary premium and a portfolio that demonstrates it.
Measure your progress by projects completed, not courses finished. Compare yourself today with yourself six months from now, not with someone who has been doing this for five years. The frustration at week four passes. The value of the skill does not.
For your next step in the data learning journey, explore our guide to data-driven decisions to understand how the analytical skills you build translate into business impact, or review our overview of what data actually is if you want to strengthen your conceptual foundation before diving deeper into Python.