
Every day, the world generates roughly 2.5 quintillion bytes of data. That is 2.5 followed by eighteen zeros, created in a single day. By the end of 2026, humanity is on track to produce over 220 zettabytes in a single year. These numbers are staggering, but they raise a more fundamental question: what actually is data?
Understanding data at a conceptual level is not just an academic exercise. 88% of enterprise leaders now consider data literacy essential for day-to-day work, and organisations that invest in data literacy are twice as likely to report transformational business outcomes. Whether you are starting a career in analytics, working in a regulated industry like banking, or simply trying to make sense of the digital world around you, this guide will give you the foundation you need.
What You'll Learn
· A clear, practical definition of data and why it matters in 2026
· The difference between data and information (and why the distinction is important)
· How data is classified: qualitative vs quantitative, structured vs unstructured
· The DIKW hierarchy illustrated with a real banking scenario
· What makes data 'personal' under regulations like GDPR, and why that matters from day one
Defining Data: More Than Just Numbers
At its simplest, data is a collection of raw facts, observations, or measurements. A temperature reading. A transaction amount. A customer name. A timestamp on an email. None of these carry much meaning on their own; they are fragments of reality captured in a form that can be recorded and processed.
But "raw facts" only scratches the surface. Data is also the record of every swipe of a credit card, every sensor reading from an IoT device, every MRI scan stored in a hospital system. It is the foundation on which decisions are made, models are trained, and organisations operate. If you have read our exploration of how data functions like the red cells of our digital world, you will recognise this idea: data is the lifeblood of every modern system.
What makes data powerful is not its volume but what happens when it is organised, analysed, and interpreted. That progression, from raw facts to actionable insight, is what separates data from information, knowledge, and wisdom.
Data vs Information: Why the Distinction Matters
People often use "data" and "information" interchangeably, but they are not the same thing. Data is the raw input; information is what you get when data is processed, structured, and given context.
Consider an example from banking. A list of one thousand transaction amounts is data. Once you aggregate those transactions by month, calculate averages, and identify the highest spending categories, you have turned that data into information. The data tells you what happened; the information starts to tell you what it means.
This distinction matters because data on its own can mislead. A single number without context (say, "42") is meaningless. Is it a temperature? A test score? A transaction count? Only when you add structure and context does that number become useful. As we covered in our practical guide to data-driven decisions, the quality of your decisions depends not just on having data, but on understanding what that data actually represents.
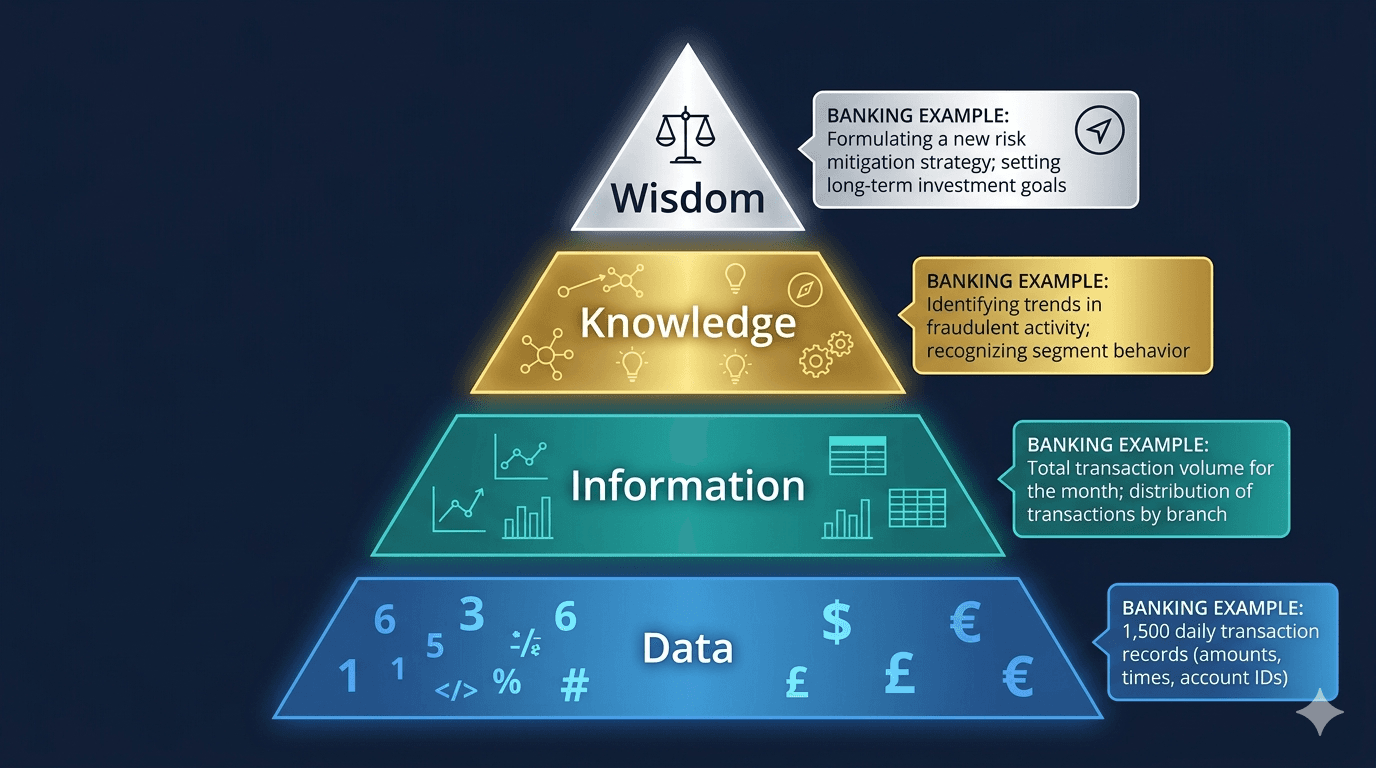
The DIKW Hierarchy: From Raw Facts to Real Wisdom
The relationship between data, information, knowledge, and wisdom is often represented as the DIKW pyramid, a framework first formalised by Russell Ackoff in 1989. Each level builds on the one below it:
· Data: Individual transaction records: amounts, dates, merchant codes, account IDs.
· Information: Monthly spending summaries grouped by category, with averages and trends highlighted.
· Knowledge: Recognising that a customer consistently overspends in the final week of each month, likely due to salary timing.
· Wisdom: Proactively offering that customer a budgeting tool or adjusting their credit limit review cycle to prevent defaults.
This progression is not abstract. It is exactly what happens inside banks, insurance companies, and fintech platforms every day. The ability to move from data to wisdom is what separates organisations that react from those that anticipate. If you are curious about how these roles are structured in practice, our modern data career map breaks down who does what at each level of this hierarchy.
How Data Is Classified
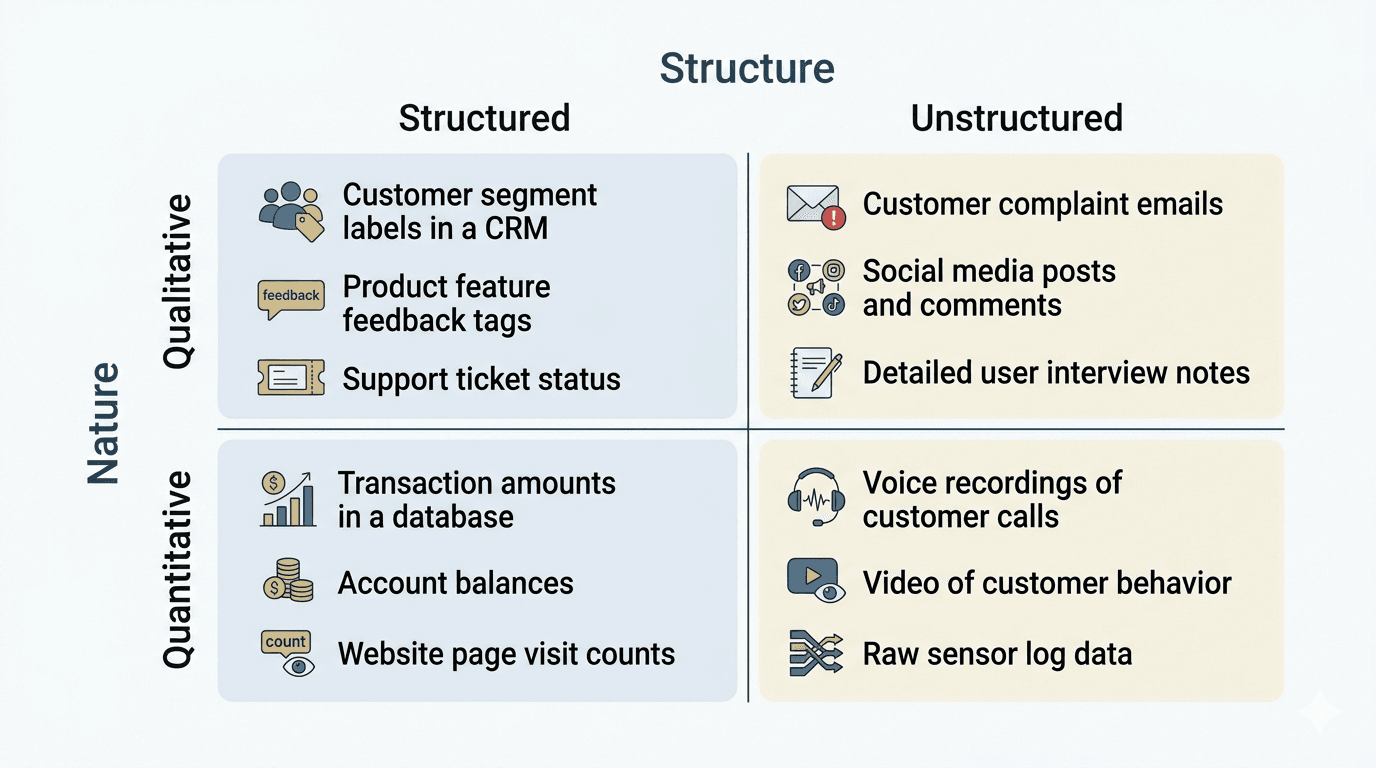
Data can be classified along several dimensions. The two most important for beginners are the nature of the data (qualitative vs quantitative) and its structure (structured vs unstructured).
Qualitative vs Quantitative Data
Qualitative data describes characteristics and categories. It answers questions like "what kind?" or "which group?" and is further divided into:
· Nominal: Labels with no inherent order. Examples: country names, customer segments (retail, corporate, institutional), blood types.
· Ordinal: Categories with a meaningful order but no consistent spacing between them. Examples: credit ratings (AAA, AA, A, BBB), customer satisfaction scores (poor, fair, good, excellent).
Quantitative data represents measurable quantities and is divided into:
· Interval: Ordered values with consistent intervals but no true zero point. Examples: temperature in Celsius (0 degrees does not mean "no temperature"), calendar years.
· Ratio: Values with a true zero and meaningful ratios. Examples: income, loan amounts, account balances (zero genuinely means "nothing").
In practice, understanding these distinctions shapes how you analyse data. You cannot meaningfully calculate an "average credit rating" (ordinal data), but you can calculate an average loan amount (ratio data). Getting this wrong leads to flawed analysis, and in regulated contexts like banking, flawed analysis can lead to regulatory scrutiny.
Structured vs Unstructured Data
Structured data fits neatly into rows and columns: spreadsheets, relational databases, CSV files. Most traditional business data (transactions, customer records, inventory counts) is structured. It is easy to search, sort, and analyse using tools like SQL and Excel.
Unstructured data does not follow a predefined format: emails, images, audio files, social media posts, PDF documents. IBM estimates that unstructured data makes up the vast majority of data created today. Analysing it typically requires more advanced tools, including natural language processing and computer vision.
Semi-structured data sits in between: JSON, XML, and log files have some organisational properties but are not rigid enough for a traditional spreadsheet. If you want to understand how all three types flow through an organisation, our guide to the data ecosystem maps the full journey from source to storage to analysis.
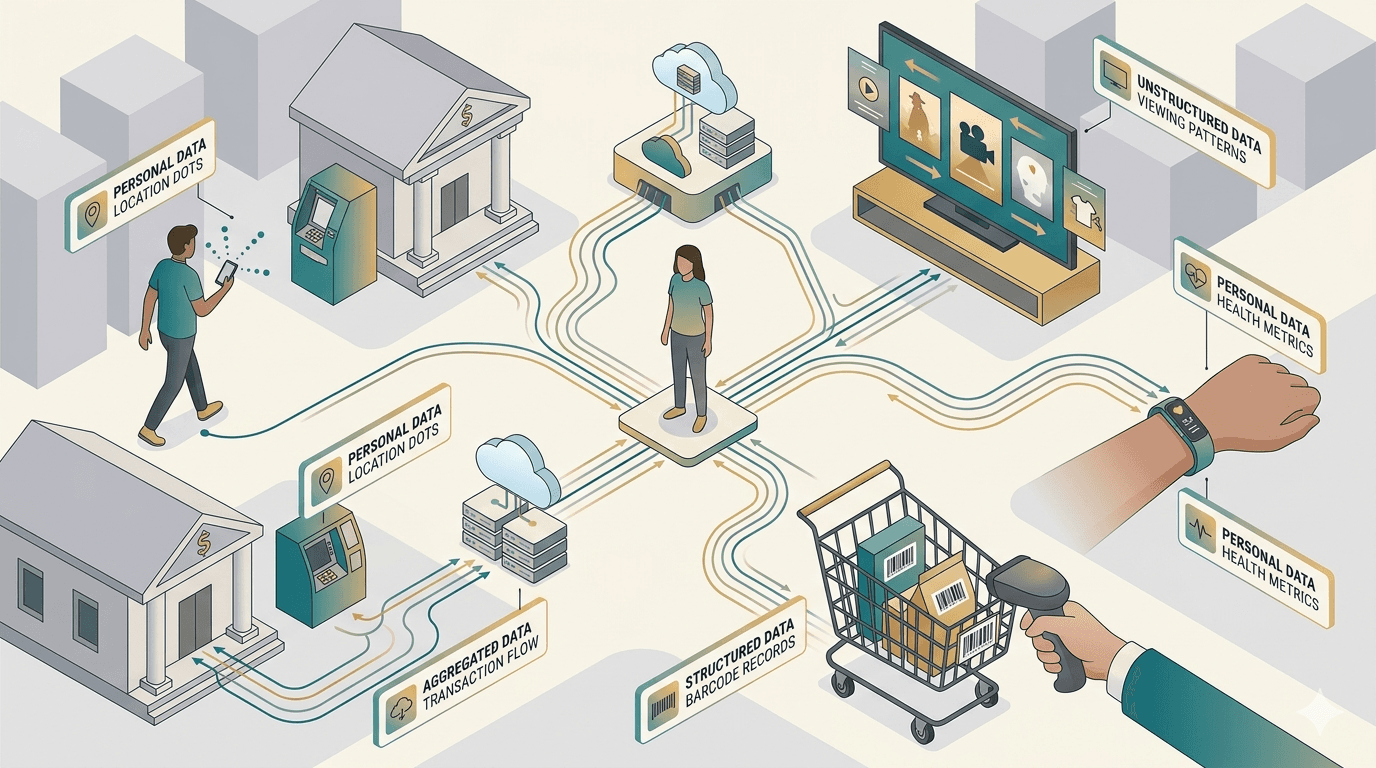
Data in the Real World: From Your Phone to Your Bank
Data is not confined to spreadsheets and databases. It surrounds you:
· Your smartphone generates location data, app usage patterns, and health metrics every minute of every day.
· Supermarkets track every item you buy and use that data to personalise offers and manage supply chains.
· Streaming platforms analyse your viewing history (structured data) alongside your reviews and comments (unstructured data) to recommend content.
In financial services, the stakes are higher. Banks process millions of transactions daily, each one a data point feeding into fraud detection, credit scoring, regulatory reporting, and customer analytics. The data that determines whether you are approved for a mortgage, flagged for suspicious activity, or offered a new product is governed by strict regulations and must meet exacting quality standards.
This is why understanding data is not optional for anyone working in, or aspiring to work in, data-adjacent roles. The foundational tools you choose to learn all serve the same purpose: helping you collect, process, and make sense of data.
Why Data Governance Matters from Day One
Many beginner guides treat data governance as an advanced topic. We disagree. In a world where GDPR defines personal data as "any information relating to an identified or identifiable natural person," understanding the regulatory weight of data is foundational.
In financial services, the implications are immediate. Every customer name, every account number, every credit decision is personal data subject to strict rules about how it can be collected, stored, processed, and shared. GDPR requires organisations to report personal data breaches within 72 hours. Getting data governance wrong is not just a technical failure; it is a legal and reputational risk.
Even if you are just starting out, knowing that data carries weight, that it has owners, rules, and consequences, will make you a more thoughtful and effective data professional. As we explore elsewhere on NeuroNomixer, the intersection of regulation, data, and AI is one of the defining challenges of this decade.
Where to Go from Here
Data is the raw material of the digital age. Understanding what it is, how it is classified, and why it matters is the first step toward working with it effectively. Whether you plan to become a data analyst, a machine learning engineer, or a business leader who makes decisions backed by evidence, this conceptual foundation will serve you at every stage.
If you are ready to go deeper, start with our guide to the data ecosystem, which maps how data flows through modern organisations, from collection and storage to transformation and governance. Or explore our modern data career map to see where your interest in data could take you professionally.
At NeuroNomixer, we believe that understanding data is the starting point for understanding everything else: AI, analytics, regulation, and the systems that shape our world. This is just the beginning.
Continue Reading
· Data, the Red Cells of Our Digital World's Veins : A deeper look at how data types and the data lifecycle work in practice.
· Inside the Data Ecosystem : How data flows through organisations, from source to insight.
· The Modern Data Career Map : Find where your interest in data could take you professionally.