
It is 2026. Python is everywhere. Power BI handles millions of rows. Cloud data warehouses have eliminated file limits. And yet: between 1.1 and 1.5 billion people still use Microsoft Excel. Ninety-six per cent of financial planning and analysis teams open it every day. Eighty-one per cent of businesses still rely on it for ad-hoc analysis.
If Excel is dying, someone forgot to tell the spreadsheet.
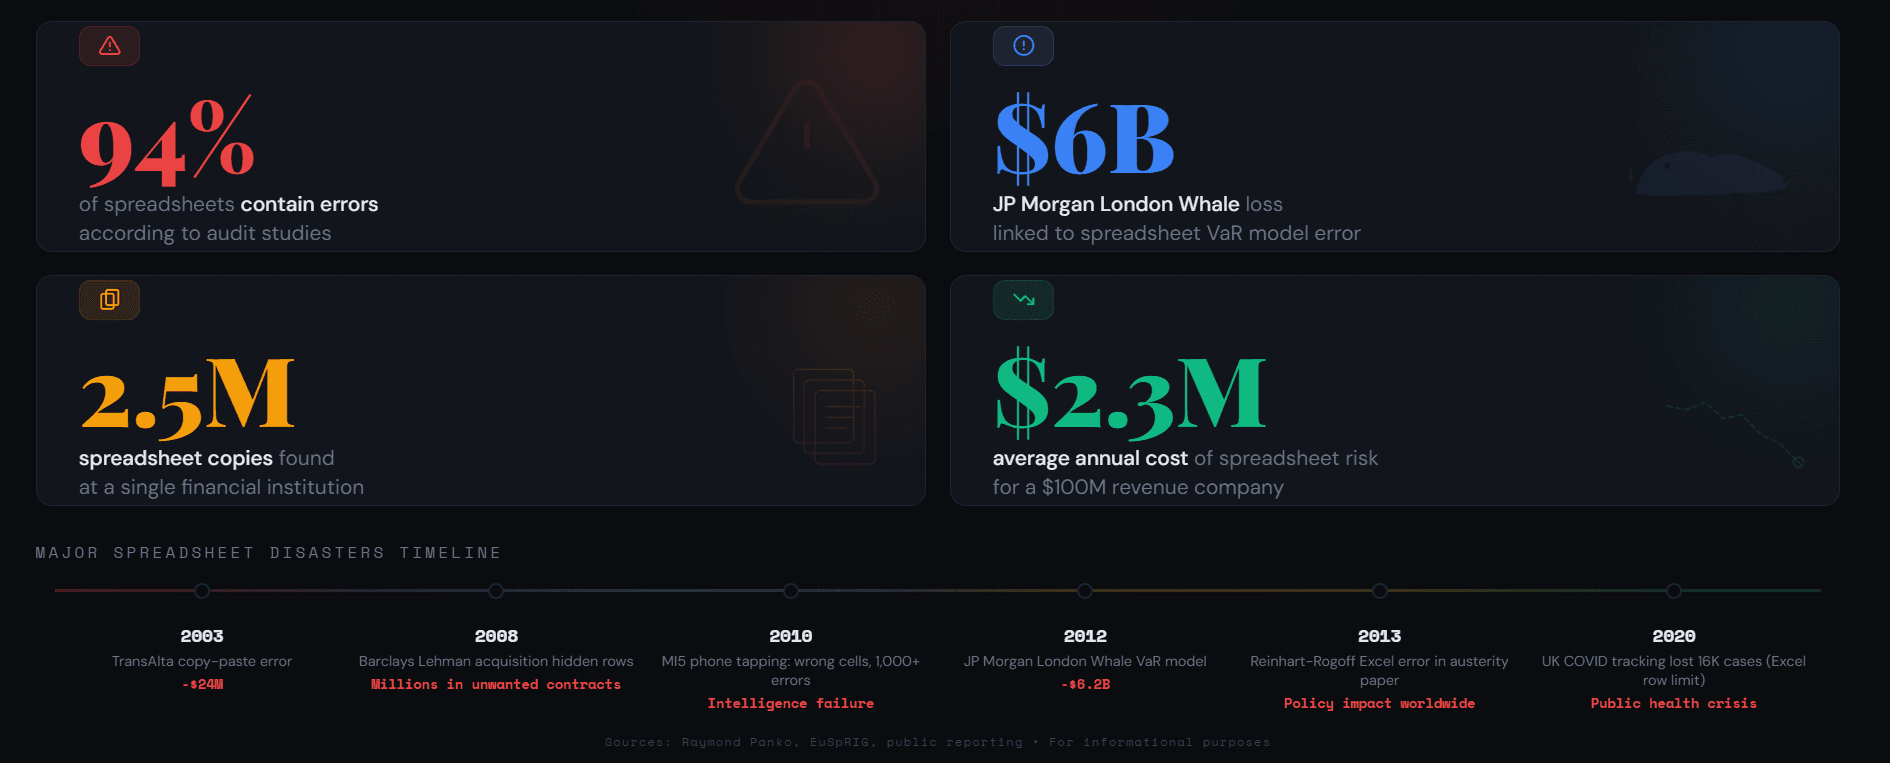
But here is the other side: 94% of business spreadsheets contain errors. In 2012, a copy-paste mistake in an Excel risk model contributed to JP Morgan's $6 billion London Whale loss. In 2020, Public Health England missed 16,000 COVID test results because data exceeded Excel's row limit. The most ubiquitous analytics tool in the world is also one of the most error-prone.
The question is not whether Excel matters. It obviously does. The question is: what has changed about what Excel is good for, what should you stop using it for, and how do you manage the risks of a tool that is simultaneously indispensable and dangerous?
What You Will Learn
• How Excel has evolved in 2025 and 2026: Copilot, Python in Excel, Power Query, and what these features actually change
• Where Excel still outperforms Python, Power BI, and other tools
• Where Excel fails and should not be used, no matter how comfortable you are with it
• The spreadsheet risk problem that most organisations ignore
• A practical framework for choosing the right tool for the right task
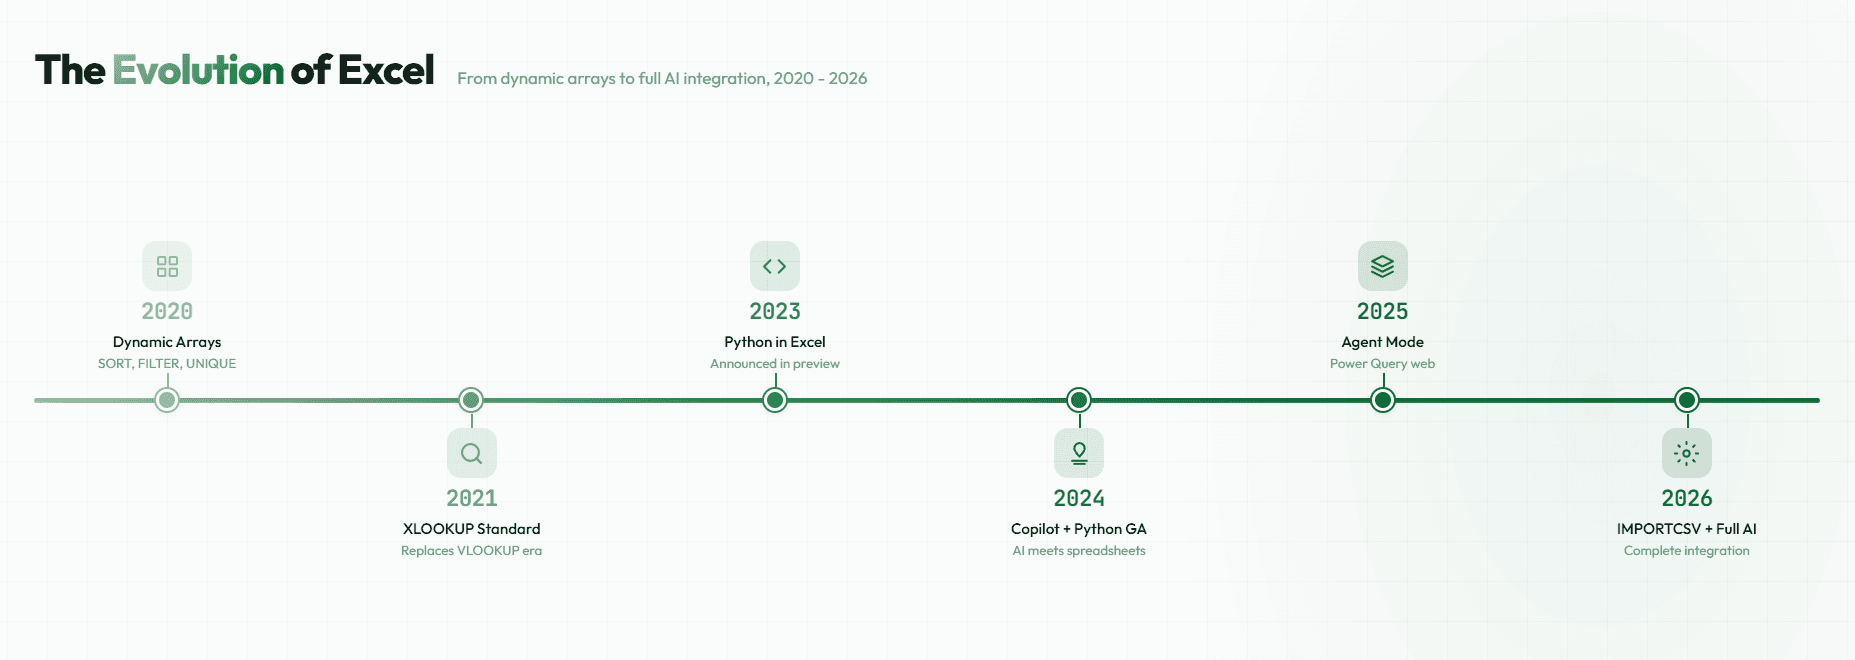
Excel Is Not Dying; It Is Being Rebuilt
If you have not opened Excel in a few months, you might be surprised by what Microsoft has added. The tool your university professor used to teach VLOOKUP has undergone genuine transformation.
Copilot: AI Inside the Spreadsheet
Copilot in Excel now suggests formulas as you type, analyses data patterns, builds charts from natural language prompts, and in its new Agent Mode, plans and executes multi-step analytical tasks automatically. You can describe what you want ("show me the top ten customers by revenue growth over the last quarter") and Copilot generates the formulas, PivotTables, and visualisations to answer it.
This changes what "Excel skill" means. The shift is from building formulas to describing outcomes, from mastering VLOOKUP syntax to knowing which questions to ask. For analysts, this is liberating. For governance professionals, it raises a question that most feature announcements ignore: when AI generates a formula, who validates it?
Python in Excel: Breaking the Language Barrier
Python in Excel is now generally available for Windows users on Microsoft 365 Business and Enterprise. Using the =PY function, you can write Python code directly in cells, with access to Pandas, Matplotlib, NumPy, and NLTK. The code runs securely on Microsoft's cloud, not on your local machine.
This is significant because it bridges the gap that has defined the "Excel vs Python" debate for years. You no longer need to choose between Excel's accessibility and Python's analytical power for many tasks. You can run Monte Carlo simulations, create statistical visualisations, and process text data without leaving the spreadsheet interface.
But be realistic about what this is. Python in Excel is still young. It is cloud-dependent, which means latency and connectivity matter. It does not eliminate Excel's fundamental constraints: the row limits, the version control problems, the error rates. It adds capability on top of existing limitations.
Power Query and Dynamic Arrays
Power Query is now fully available in Excel for the web, connecting to over 500 data sources with natural language transformation steps. Dynamic array functions like XLOOKUP, FILTER, and the new IMPORTCSV (January 2026) eliminate the workarounds that made Excel formulas unnecessarily complex for decades.
These are genuine improvements. Power Query in particular transforms Excel from a static tool into something closer to an automated data pipeline for small-to-medium workflows. But the improvements coexist with the same fundamental constraints. The row limit is still 1,048,576. Version control is still absent. Error rates have not improved.
Excel's evolution is real, but evolution is not transformation. It is still fundamentally a spreadsheet, just with more powerful features bolted on.
The Tool Stack Reality: Stop Asking "Excel or Python" and Start Combining
The most common question in data forums, "Should I learn Excel or Python?" is the wrong question. The data shows that the answer is both, and that most working analysts already use multiple tools.
According to job market analysis, SQL and Excel each appear in 64% of data analyst job postings. Python appears in 36%. Tableau in 22%. The pattern is overlap, not replacement. The tools are complementary, and the best analysts know which one fits which problem.
| Career Stage | Core Tools | Why This Combination |
| Entry-level analyst | Excel + SQL | Quick wins, practical skills, covers 80% of daily tasks |
| Senior analyst | Excel + SQL + Python + BI tool | Full analytical capability; automation; reporting at scale |
| Analytics engineer | Python + SQL + dbt + BI tool | Pipeline-focused; Excel becomes occasional exploration tool |
| FP&A professional | Excel + Power BI | Financial modelling remains Excel-native; dashboards in BI |
The best data professionals are not Excel experts or Python experts. They are tool-selection experts. They know which tool solves which problem, and they use all of them. If you are building a career in data, learning to choose the right tool for the right problem is more valuable than mastering any single tool.
What Excel Still Does Better Than Anything Else
Speed to Insight
When you need an answer in two hours, not two weeks, Excel wins. Open a file, paste data, build a PivotTable, create a chart, present to your team. No environment setup. No package installation. No code review. The friction between question and answer is close to zero, and that matters enormously in business contexts where speed is the constraint, not sophistication.
Accessibility and Universal Literacy
Between 1.1 and 1.5 billion people use Excel globally. Over 203,000 verified companies run on it. Eighty-three per cent of administrative roles require it. Your CEO, your accountant, your marketing manager, and your operations director all speak Excel. This is not a technical detail; it is a strategic feature. When you send a Python script to a stakeholder, they need a developer to read it. When you send a spreadsheet, they can open it immediately and understand the logic. As our overview of foundational data tools noted, Excel's universality makes it the lingua franca of business data.
Financial Modelling and Scenario Planning
Excel remains the tool of choice for what-if analysis, sensitivity tables, scenario planning, and financial forecasting. Ninety-six per cent of FP&A teams use it daily for good reason: spreadsheet-based financial models are transparent (you can trace every calculation), flexible (change an assumption and everything recalculates instantly), and familiar to everyone in finance. Solver, Goal Seek, data tables, and built-in financial functions (NPV, IRR, XNPV) make Excel purpose-built for this work.
Power Query for Data Transformation
Power Query, now fully available in the web version of Excel, connects to over 500 data sources and supports natural language transformation steps. For analysts working with messy data from multiple sources, this eliminates the manual copy-paste workflows that were both time-consuming and error-prone. It is cleaner than writing ad-hoc SQL for one-off transformations, and it creates a repeatable, auditable pipeline within Excel itself.
The common thread across all these strengths is low friction. Excel wins when the priority is getting to an answer quickly, communicating it to people who are not technical, or modelling scenarios that require immediate visual feedback. Recognise this as a genuine advantage, not a sign of backwardness.
Where Excel Fails and Should Not Be Used
Datasets Beyond the Row Limit
Excel's hard ceiling of 1,048,576 rows per worksheet is not theoretical. Files approaching that limit slow down, crash, and corrupt. Public Health England's loss of 16,000 COVID test results in 2020 happened because data exceeded this limit. If your dataset has more than a million rows, or even approaches 500,000 rows with complex calculations, you need a database, Power BI, or Python, not Excel.
Version Control and Reproducibility
A study by Delft University found 2.5 million spreadsheet copies in existence at a single Dutch bank with 1,500 employees. Nobody knew which version was current. Excel has no branching, no merging, no conflict resolution, and its change-tracking feature is limited and periodically deleted. If your analysis needs to be reproducible, if someone needs to trace exactly what changed and when, Excel cannot provide this. Git-managed code can.
Automation at Scale
You cannot schedule Excel recalculations reliably across systems. You cannot trigger workflows across departments. You cannot run a hundred analyses in parallel. If your work requires production-grade automation, repeatable execution, or integration with modern data pipelines, you need Python, dbt, or enterprise orchestration tools. Excel was designed for interactive analysis, not automated production.
Machine Learning and AI Workflows
While Python in Excel adds some analytical capability, Excel is not designed for model training, validation, hyperparameter tuning, or ML pipeline management. If you are doing serious predictive modelling, use Python, R, or specialised ML platforms. As our guide to interpretable and black-box models explored, modern AI development requires tooling that Excel simply does not provide.
Enterprise Data Governance
Excel provides no audit trails, limited access control, unclear data lineage, and no automated compliance enforcement. If your organisation operates under regulatory requirements (financial services, healthcare, government), you need governed systems with proper controls. Excel's flexibility is precisely what makes it ungovernable at scale: anyone can change anything, and nobody can trace what happened.
The Spreadsheet Risk Problem That Most Organisations Ignore
This is the section most articles about Excel skip, and it is the one that matters most.
According to research covered by Phys.org, 94% of business spreadsheets contain errors. Nearly 88% of accounting spreadsheets have human errors. Fifty per cent of spreadsheet models used in large businesses have material defects. Formula errors cost businesses an average of 2.3% of annual revenue. For a $100 million company, that is $2.3 million per year in lost value.
The historical examples are stark. JP Morgan's London Whale disaster involved a Value-at-Risk model where a copy-paste error divided by a sum instead of an average, understating volatility by a factor of two. The model was built, maintained, and broken in Excel. TransAlta lost $24 million from a formula error in hedging contracts. Kodak overstated severance benefits by $11 million due to a spreadsheet miscalculation.
And yet 70% of CFOs still depend on Excel for planning, forecasting, and reporting. The disconnect between the known error rate and the continued reliance is a governance failure, not a technology problem.
Here is the principle that financial services professionals, in particular, need to internalise: if Excel holds data that drives decisions, it is not a tool; it is a system. And systems need governance, including access control, change tracking, version history, audit trails, and testing protocols. Most Excel implementations have none of this. When something goes wrong, and the error statistics say it will, there is no trail to follow and no control to prevent recurrence.
Copilot and Python in Excel do not fix this. They add capability, but they also add complexity. When AI generates a formula, the risk of unvalidated logic increases, not decreases. The governance question is not whether to use Excel; it is whether your organisation treats its critical spreadsheets with the same rigour it applies to any other enterprise system. For more on why governance is foundational to working with data responsibly, see our guide to what data is and why governance starts on day one.
What Comes Next: Excel as AI-Augmented Interface
The trajectory is clear. Excel is becoming an AI-augmented analytics interface. Copilot handles formula generation and pattern recognition. Python in Excel brings statistical and analytical depth. Power Query automates data pipelines. The skill requirement is shifting from formula mastery to analytical thinking, from "Can you build a VLOOKUP?" to "Do you know what question to ask and how to validate the answer?"
In financial services, this shift is already visible. Banks no longer want what some industry observers have called "Excel monkeys": analysts who build models mechanically. They want professionals who understand when models are wrong, who can think about risk and scenarios, and who can communicate insights clearly. AI handles the construction; humans handle the judgment.
This aligns directly with what the EU AI Act demands of organisations deploying AI in high-risk contexts: transparency, explainability, and human oversight. When Copilot generates an analytical output in Excel, someone needs to understand what it produced and whether it is correct. That someone is you.
But do not confuse Excel's evolution with Excel solving its problems. Copilot does not fix the row limit. Python in Excel does not provide version control. Agent Mode does not resolve governance. Excel is getting more powerful. It is not becoming a different kind of tool. It is still a spreadsheet. And spreadsheets still have inherent limits. Pretending they do not is how you get another London Whale.
Choosing Intentionally, Not by Default
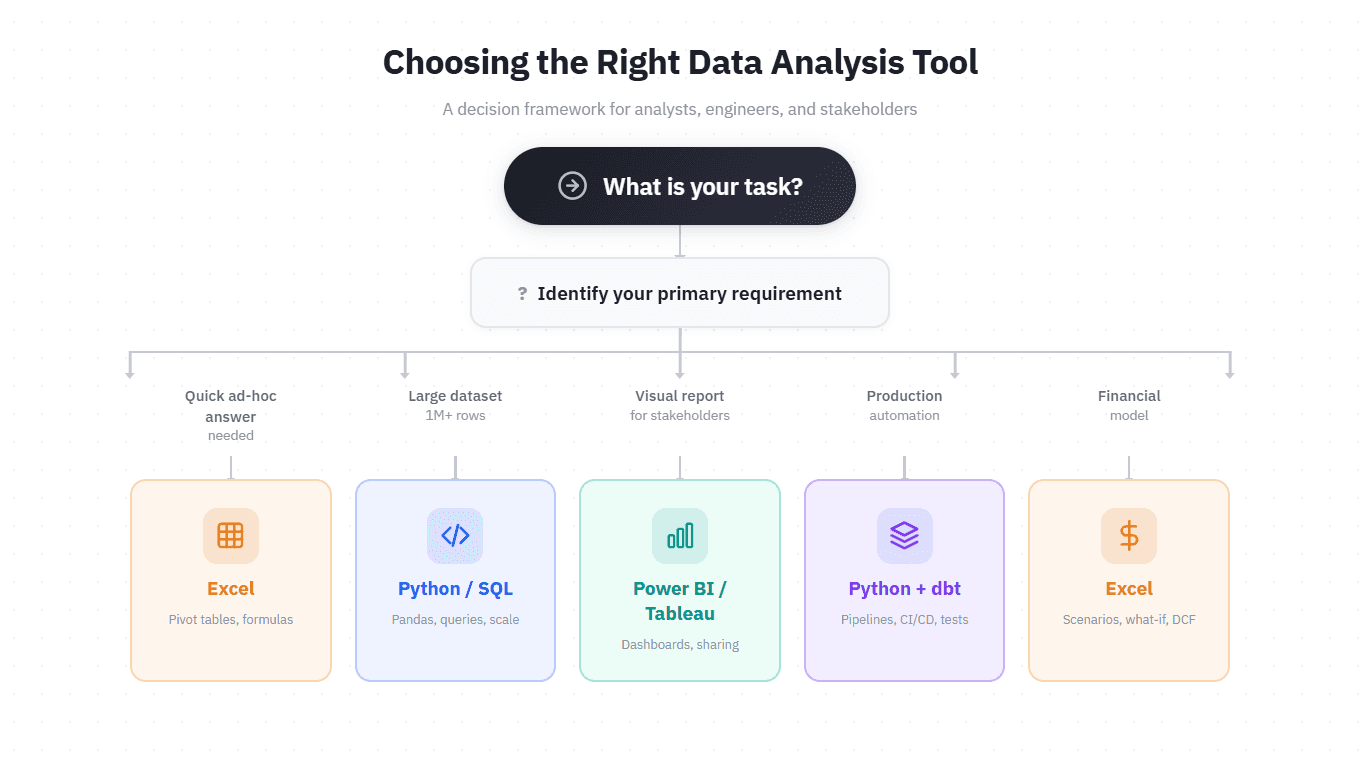
The question is not "Should I use Excel or Python?" The question is: for this specific problem, with these constraints, for this team, which tool is right?
• Quick analysis, small dataset, one person: Excel.
• Large dataset, automation, reproducibility: Python and SQL.
• Visual storytelling for a business audience: Power BI or Tableau.
• Ad-hoc exploration before deciding on a bigger tool: Excel.
• Production system with audit requirements: Database, code, and governance tooling.
• Most real-world analytical work: A combination of all of the above.
If you are starting out in data, learn Excel first. It gives you quick wins, builds intuition for data, and teaches you how to think about structure. Then add SQL, as our guide to why SQL remains the most important skill in data explains. Then learn Python. Do not skip Excel because it is not fashionable. But do not pretend it is the only tool you will ever need.
If you are experienced, use Excel for what it is good at: speed, clarity, exploration, and financial modelling. Use Python and databases for what Excel is bad at: scale, automation, governance, and reproducibility. And if your organisation depends on critical spreadsheets, treat them like enterprise systems. Document them. Test them. Version them. Audit them.
Excel in 2026 is more powerful and more relevant than most people think. But it is also exactly as constrained as it has always been. The features are better. The limits remain. Choose intentionally, not by default. And when Excel is the right tool, use it well, because the $6 billion lesson from JP Morgan's London Whale still applies: spreadsheet errors do not care how smart you are or how many new features Microsoft has added.
Continue Reading
• Why SQL Is Still the Most Important Skill in Data, and How to Start Learning It : the next tool to learn after Excel
• Data Analyst vs Data Scientist vs Analytics Engineer: Which Role Fits You? : understanding which tools each role uses
• The Data Lifecycle: How Information Flows Through Modern Organisations : where Excel fits in the broader data pipeline